
# MongoDB 高级
# 参考文档
# 聚合查询
db.collection. aggregate(pipeline,options)
pipeline,管道,array 类型,数据会按照管道定义顺序流动。options,选项参数。
示例:
db.orders.aggregate(
    [
        // 将数组中数据展开
        { $unwind: "$tags"}
        // $match 指定 query 条件
        { $match: { status: "A" } },
        // _id 指定按照哪个字段去分组
        { $group: { _id: "$cust_id", total: { $sum: "$amount" } } },
        // 多字段分组时需要设置一个别名
        // { $group: { _id: { "custId": "$cust_id", "bId": "$b_id"}, total: { $sum: "$amount" } } },
        { $sort: { total: -1 } }
    ],
    {
        explain: true,
        // 使用外部排序执行大型排序操作
        allowDiskUse: true,
        // 指定初始批量大小
        cursor: { batchSize: 0 },
        // 指定索引
        hint: { qty: 1, category: 1 }
    }
)
2
3
4
5
6
7
8
9
10
11
12
13
14
15
16
17
18
19
20
21
22
unwind 作用是将一条记录,按照某个数组展开,变成多条文档(仅这个值有区别,其他的值都相同)。示例:
// 现有数据
{
    "_id" : ObjectId("645390f5aa2b30b7a0dab260"),
    "name" : "Mario",
    "age" : NumberInt(18),
    "tags" : [
        "smart",
        "intelligent"
    ]
}
// unwind
db.getCollection("member").aggregate([
    {"$unwind":"$tags"}
])
// result
{
    "_id" : ObjectId("645390f5aa2b30b7a0dab260"),
    "name" : "Mario",
    "age" : NumberInt(18),
    "tags" : "smart"
}
{
    "_id" : ObjectId("645390f5aa2b30b7a0dab260"),
    "name" : "Mario",
    "age" : NumberInt(18),
    "tags" : "intelligent"
}
2
3
4
5
6
7
8
9
10
11
12
13
14
15
16
17
18
19
20
21
22
23
24
25
26
27
按时间(比如每个月)分组:
db.getCollection("vodDailyPlayStats").aggregate([
    {"$match": {accountId:ObjectId('xxx'),"isDeleted":false}},
    {"$group": {
        "_id":{
            "$dateToString": {
                "format": "%Y-%m",
                "date": {
                    "$add": ["$createdAt"]
                }
            }
        },
        "total": {$sum:"$playTimes"}
    }}
])
2
3
4
5
6
7
8
9
10
11
12
13
14
# 索引
1 升序, -1 降序
创建索引 db.collection.createIndex(<key: type>, <options>),type = 1 (升序) | -1 (降序)。
示例:
- 创建普通索引:
db.collection.createIndex( { key: 1 } ) - 后台创建:
db.collection.createIndex( { key: 1 }, {background: true} )- background 设为 true,指的是不要阻塞数据库的其他操作,保证数据库的可用性。
- 创建唯一索引:
db.collection.createIndex( { key: 1 }, { unique: true } )
创建出来的索引名称默认规则是:索引键和索引中每个键的方向(即 1 或 -1 )的连接,使用下划线作为分隔符,例如 a_1_b_-1。当然也手动指定索引的名字:
db.products.createIndex(
    { item: 1, quantity: -1 } ,
    { name: "query for inventory" }
)
2
3
4
使用 db.collection.getIndexes() 查看索引。
# 最左前缀原则
最左前缀原则,或最左匹配原则,最左前缀匹配原则 指的是同一个东西。
数据库索引分为单键索引和复合索引,单键索引的命中无需多说。最左前缀原则是指在复合索引中的命中规则。
假如有一个索引 a_1_b_1_c_1,当查询 a、a+b、a+b+c 都可以命中该索引,但是 b、b+c、c 就不能命中索引。
另外,a+c 也会命中索引,它会从所有 a 相同的数据中查询等于 c 的数据。
# 查询分析
MongoDB 查询分析可以确保我们建议的索引是否有效,是查询语句性能分析的重要工具。
MongoDB 查询分析常用函数有:explain() 和 hint()。
# Explain
执行计划分析
在 MongoDB 中可以使用 db.collection.explain()、cursort.explain() 及 explain 命令,获取查询计划及查询计划统计信息。
现版本 explain 有三种模式,分别是:queryPlanner(默认模式)、executionStats、allPlansExecution。
queryPlanner,查询计划的选择器,首先进行查询分析,最终选择一个 winningPlan,是 explain 返回的默认层面。db.collection.find().explain()
executionStats,为执行统计层面,返回 winningPlan 的统计结果db.collection.find().explain("executionStats")
allPlansExecution,为返回所有执行计划的统计,包括 rejectedPlan。db.collection.find().explain("allPlansExecution")ordb.collection.find().explain({})
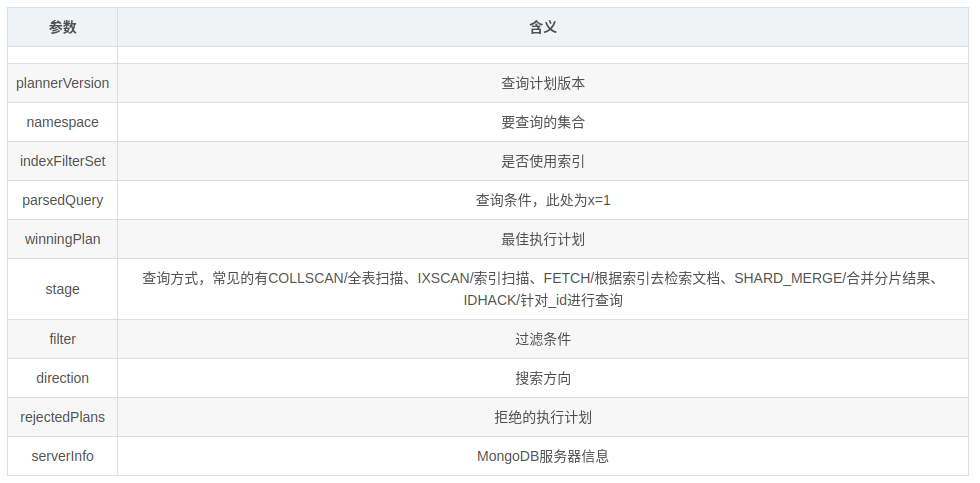
queryPlanner 是现版本 explain 的默认模式。这种模式并不会真正进行 query 语句查询,而是针对 query 语句进行执行计划分析并选出 winning plan。
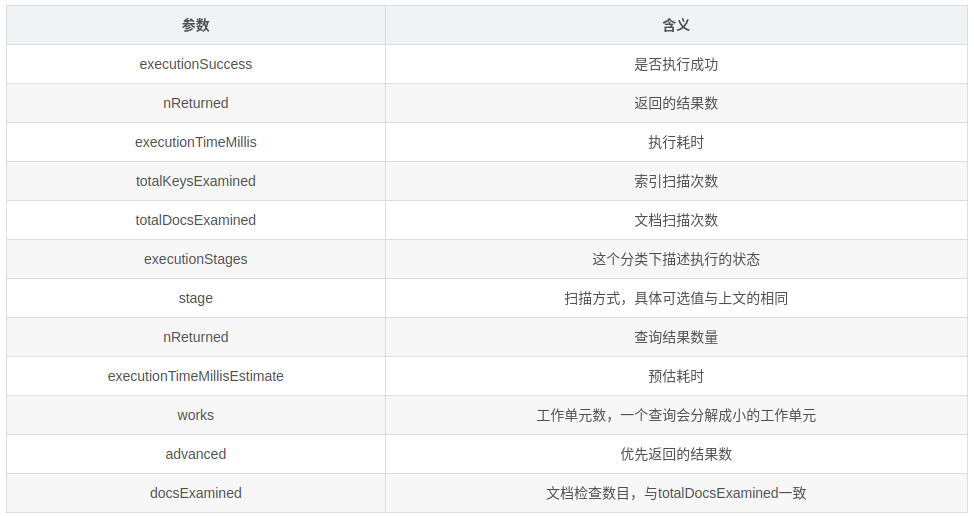
我们在查询优化的时候,只需要关注 queryPlanner,executionStats 即可,因为 queryPlanner 为我们选择出了 winningPlan,而 executionStats 为我们统计了 winningPlan 的所有关键数据。
点开查看结果释义
{
    "queryPlanner":{
        "plannerVersion":1,
        "namespace":"mongotest.users", // db.table,该query所查询的表
        "indexFilterSet":false, // 针对该 query 是否有 indexfilter
        "parsedQuery":{ // 查询条件(格式化后)
            "name":{
                "$eq":"ghost"
            }
        },
        "winningPlan":{ // 查询优化器针对该 query 所返回的 最优执行计划 的详细内容。
            "stage":"FETCH", // 最优执行计划的 stage,这里返回是 FETCH,可以理解为通过返回的 index 位置去检索具体的文档
            "inputStage":{ // 用来描述子 stage,并且为其父 stage 提供文档和索引关键字
                "stage":"IXSCAN", // stage的 child stage,此处是 IXSCAN,表示进行的是 index scanning。
                "keyPattern":{ // 所扫描的 index 内容
                "name":1.0,
                "age":1.0
                },
                "indexName":"name_1_age_1", // winning plan 所选用的 index。
                "isMultiKey":false, // 是否是 Multikey,此处返回是 false,如果索引建立在 array 上,此处将是 true。
                "multiKeyPaths":{
                    "name":[

                    ],
                    "age":[

                    ]
                },
                "isUnique":false,
                "isSparse":false,
                "isPartial":false,
                "indexVersion":2,
                "direction":"forward", // 此 query 的查询顺序,此处是 forward,如果用了 .sort({modify_time:-1}) 将显示 backward。
                "indexBounds":{ // winningplan 所扫描的索引范围,如果没有制定范围就是 [MaxKey, MinKey],这主要是直接定位到 mongodb 的 chunck 中去查找数据,加快数据读取。
                    "name":[
                        "[\"ghost\", \"ghost\"]"
                    ],
                    "age":[
                        "[MinKey, MaxKey]"
                    ]
                }
            }
        },
        "rejectedPlans":[ // 其他执行计划(非最优而被查询优化器 reject 的)的详细返回,其中具体信息与 winningPlan 的返回中意义相同,故不在此赘述。
        ]
    },
    "serverInfo":{
        "host":"kf-PC",
        "port":27017,
        "version":"3.4.9",
        "gitVersion":"876ebee8c7dd0e2d992f36a848ff4dc50ee6603e"
    },
    "ok":1.0
}
2
3
4
5
6
7
8
9
10
11
12
13
14
15
16
17
18
19
20
21
22
23
24
25
26
27
28
29
30
31
32
33
34
35
36
37
38
39
40
41
42
43
44
45
46
47
48
49
50
51
52
53
54
常见 Stage 共有以下:
COLLSCAN:全表扫描IXSCAN:索引扫描FETCH:根据索引去检索指定 documentSHARD_MERGE:各个分片返回数据进行 mergeSORT:表明在内存中进行了排序(与前期版本的 scanAndOrder:true 一致)SORT_MERGE:表明在内存中进行了排序后再合并LIMIT:使用 limit 限制返回数SKIP:使用 skip 进行跳过IDHACK:针对 _id 进行查询SHARDING_FILTER:通过 mongos 对分片数据进行查询COUNT:利用 db.coll.count() 之类进行 count 运算COUNTSCAN:count 不使用用 Index 进行 count 时的 stage 返回COUNT_SCAN:count 使用了 Index 进行 count 时的 stage 返回SUBPLA:未使用到索引的 $or 查询的 stage 返回TEXT:使用全文索引进行查询时候的 stage 返回
queryPlanner 图解:
executionStats 图解:
# Hint
虽然 MongoDB 查询优化器一般工作的很不错,但是也可以使用 hint 来强制 MongoDB 使用一个指定的索引。
示例:指定使用 name 和 age 索引字段来查询:
db.users.find({name:"ghost"}).hint({name:1,age:1})
可以使用 explain() 函数来分析以上查询:
db.users.find({name:"ghost"}).hint({name:1,age:1}).explain()
# Mongo Profiler
Mongo 分析器(Profiler)
Mongo Profiler 收集了针对正在运行的 Mongod 实例执行的数据库命令的详细信息(包括 CRUD 操作以及配置和管理命令),并将这些信息存放在 system.profile collection 中,默认情况下是关闭的,我们可以在数据库级别上或者是节点级别上配置。
Profiling Levels 有以下 3 种:
- 0,关闭,不收集任何数据。default
- 1,收集耗时长(默认设置 >100ms)的操作,或者根据 filter (count/find/insert/update...)收集。
- 2,收集所有数据(所有数据库,所有操作)。
# 配置分析器
profiler 有 2 个相关参数,slowms 和 sampleRate, 当通过 profile 命令或者 db.setProfilingLevel() 方法来设置时,那么就是单个数据库级别的配置。当通过配置文件来设置时,那么就是全局配置,对所有实例都生效。
# 配置 slowms
通过以下方式设置慢操作的阈值:
- 通过 profile 命令或者
db.setProfilingLevel(int level)方法来设置。 - 在启动 mongodb 时指定
-slowms选项。 - 在配置文件中设置
slowOpThresholdMs的值。
比如设置阈值为 20 ms:
// set,打开之后,会在对应 database 下创建 system.profile 集合
db.setProfilingLevel(1, { slowms: 20 })
// get
db.getProfilingStatus()
2
3
4
# 配置 sampleRate
sampleRate,样本率,取样率,取值区间 0~1。
在事务量很大的清下,记录所有的慢操作可能会占用更多的资源,对系统影响也会更大,因此可以设置 sampleRate 参数,即只对所有慢操作按一定比率进行分析。 sampleRate 默认为 1,对所有慢操作进行分析,该参数的设置区间是:0~1,这里仅当 profile 级别为 1 时才有效。
通过以下方式设置:
- 通过 profile 命令或者
db.setProfilingLevel()方法进行设置。 - 在启动实例时指定
-slowOpSampleRate参数。 - 在配置文件中指定
slowOpSampleRate参数。
比如,设置只对所有慢操作的进行随机采样(35% 比例)进行分析:
// set,打开之后,会在对应 database 下创建 system.profile 集合
db.setProfilingLevel(1, { sampleRate: 0.35 })
// get
db.getProfilingStatus()
2
3
4
# 配置 Filter
从MongoDB 4.4.2 开始,可以配置 Filter 来控制 profiled 的操作。
可以通过如下方法来配置 Filter:
- 通过 profile 命令或者
db.setProfilingLevel()方法。 - 在配置文件中设置
filter。
对于 mongod 实例,filter 会影响 diagnostic log 和 profiler(如果启用了)。
对于 mongos 实例,filter 只影响 diagnostic log,因为 profiling 不支持 mongos 实例。
注意: 设置 filter 之后,slowms 和 sampleRate 选项将失效。
比如,通过 filter 仅记录超过 2s 的 query 操作:
db.setProfilingLevel( 2, { filter: { op: "query", millis: { $gt: 2000 } } } )
# Profiler 日志
使用 db.system.profile.find() 查询,其实就是跟查询正常的数据库记录一样。
# 示例
查找最近 10 条日志:
db.system.profile.find().limit(10).sort( { ts : -1 } ).pretty()。
查看 command($cmd) 操作外的所有操作:
db.system.profile.find( { op: { $ne : 'command' } } ).pretty()。
查看特定集合的操作:
db.system.profile.find( { ns : 'cndba.user' } ).pretty()。
查看操作超过 5ms 的操作:
db.system.profile.find( { millis : { $gt : 5 } } ).pretty()。查看特定时间范围的操作:
db.system.profile.find({
    ts : {
        $gt: new ISODate("2012-12-09T03:00:00Z"),
        $lt: new ISODate("2012-12-09T03:40:00Z")
    }
}).pretty()
1
2
3
4
5
6
# 日志详解
具体可见官网 Database Profiler Output (opens new window)。
查询操作样例
{
    // 操作类型
    // command、insert、query、remove、update、count、distinct、group、mapReduce、geoNear、getMore
    "op" : "query",
    // namespace,<db.collection>,以点分隔
    // 这里指操作的是 test 数据库中的 report 集合
    "ns" : "test.report",
    // 操作命令的详细信息
    "command" : {
        "find" : "report",
        "filter" : { "a" : { "$lte" : 500 } },
        "lsid" : {
            "id" : UUID("5ccd5b81-b023-41f3-8959-bf99ed696ce9")
        },
        "$db" : "test"
    },
    "cursorid" : 33629063128,
    // 为执行操作,扫描的索引 key 的数量
    "keysExamined" : 101,
    // 为执行操作,扫描的文档数量
    "docsExamined" : 101,
    "fromMultiPlanner" : true,
    // 为了让别的操作完成而屈服(让出锁)的次数,一般发生在需要访问的数据尚未被完全读取到内存中,MongoDB 会优先完成在内存中的操作
    // 如果没有其他操作处于等锁(waitingForLock)的状态,则改操作不会交出锁(yield)。
    "numYield" : 2,
    // 返回数量
    "nreturned" : 101,
    "queryHash" : "811451DD",
    "planCacheKey" : "759981BA",
    // 操作中锁信息(Type、Mode)
    // Type: Global、Database、Collection、Mutex、Metadata、oplog
    // Mode: R、W、r、w
    "locks" : {
        "Global" : {
            "acquireCount" : { // 具体每种锁请求的次数
                "r" : NumberLong(3),
                "w" : NumberLong(3)
            }
        },
        "Database" : {
            "acquireCount" : { "r" : NumberLong(3) },
            "acquireWaitCount" : { "r" : NumberLong(1) },
            "timeAcquiringMicros" : { "r" : NumberLong(69130694) }
        },
        "Collection" : {
            "acquireCount" : { "r" : NumberLong(3) }
        }
    },
    "storage" : {
        "data" : {
            "bytesRead" : NumberLong(14736),
            "timeReadingMicros" : NumberLong(17)
        }
    },
    "responseLength" : 1305014,
    "protocol" : "op_msg",
    // 操作开始到结束的时间,具体执行时间/ms
    "millis" : 69132,
    // 执行计划
    "planSummary" : "IXSCAN { a: 1, _id: -1 }",
    // 执行计划的 stage
    "execStats" : {
        "stage" : "FETCH",
        "nReturned" : 101,
        "executionTimeMillisEstimate" : 0,
        "works" : 101,
        "advanced" : 101,
        "needTime" : 0,
        "needYield" : 0,
        "saveState" : 3,
        "restoreState" : 2,
        "isEOF" : 0,
        "docsExamined" : 101,
        "alreadyHasObj" : 0,
        "inputStage" : {
            ...
        }
    },
    // 操作执行时间
    "ts" : ISODate("2019-01-14T16:57:33.450Z"),
    "client" : "127.0.0.1",
    "appName" : "MongoDB Shell",
    "allUsers" : [
        {
            "user" : "someuser",
            "db" : "admin"
        }
    ],
    "user" : "someuser@admin"
}
2
3
4
5
6
7
8
9
10
11
12
13
14
15
16
17
18
19
20
21
22
23
24
25
26
27
28
29
30
31
32
33
34
35
36
37
38
39
40
41
42
43
44
45
46
47
48
49
50
51
52
53
54
55
56
57
58
59
60
61
62
63
64
65
66
67
68
69
70
71
72
73
74
75
76
77
78
79
80
81
82
83
84
85
86
87
88
89
90
# 分析器开销
启用 profiling 会对数据库的性能有一定的影响,特别是在配置 2 级,并且阈值为 1ms 的情况下。因为分析器使用 system.profile 来存储日志,所以对磁盘空间也有一定的消耗。因此在生产环境启用 profiling 之前需要考虑其对性能和安全性的影响。
system.profile 集合是固定大小集合(capped collection),默认大小为 1M。可以使用 db.getCollection("system.profile").storageSize() 查看。该大小集合可以存储大约几千条 profile documents。因为是固定大小集合,所以当达到限制时,会覆盖最早的 documents 数据。因此,如果需要更多的 pfofling data,我们可以修改 system.profile 集合的大小。
修改步骤(以创建一个 4M 大小的 system.profile 为例):
// 1. 禁用 profiling
db.setProfilingLevel(0)
// 2. 删除 system.profile 集合
db.system.profile.drop()
// 3. 创建新的 system.profile 集合
db.createCollection( "system.profile", { capped: true, size:4000000 } )
// 4. 启用 profiling
db.setProfilingLevel(1)
2
3
4
5
6
7
8
# 优化手段
# sort&skip&limit
在查询中,无论 find().limit().skip(),还是 find().skip().limit().sort(),无论查询语句里哪个在前面,实际执行的时候的顺序永远是:
sort -> skip -> limit
如果想自定义这些操作的执行顺序,可以使用 aggregate,因为聚合的管道是按顺序执行的。
# 复合索引定义技巧
根据搜索条件来决定索引字段的顺序(ESR 原则):
- 等于字段
Equality - 排序字段
Sort - 范围查询字段
Range
# 索引对排序的影响
索引也是一堆数据,索引是一些按照指定规则排序的数据, 最终也是被存储起来的, 也是占用磁盘空间的。所以,在创建索引的时候要指定一个存储顺序(1 升序,-1 降序),告诉它是升序存储还是降序存储。
在 MongoDB 中,排序操作,可以通过从索引中按照索引的顺序获取文档的方式,来保证结果的有序性。相比于不用索引的排序操作,用索引会有更好的性能。如果 MongoDB 的查询计划器(planner) 没法从索引中得到排序顺序,那么它就需要在内存中对结果排序。不用索引的排序操作,会在用了超过 32MB 内存时终止,也就是说 MongoDB 只能支持 32MB 的非索引排序。
# 单字段索引排序
假如存在一个单字段索引 {name: 1},那么无论是 xx.sort({name: 1}) 还是 xx.sort({name: -1}) 都可以直接通过索引排序。
# 复合索引排序
对于复合索引排序,就要保证排序字段和索引字段的顺序完全相同或者相反。例如存在一个索引 {name: 1, age: 1},那么 xx.sort({name: 1, age: 1}) 和 xx.sort({name: -1, age: -1}) 都会走索引排序,其他的则不会走索引。
PS: 这个其实很容易理解,按照上述例子,{name: 1, age: 1} 索引中的数据已经先按照 name 升序,然后再按照 age 升序创建好了,你按照 xx.sort({name: 1, age: 1}) 去排序,当然这部分数据直接就是复合要求的,不用再有单独的排序这一步,自然就是省时的。但是你按照 xx.sort({name: 1, age: -1}) 这种顺序要求数据,索引的数据肯定不符合,也就自然需要重新排序,所以就多了重新排序这一步,也就是所说的没有走索引排序。
需要注意的是,复合索引的排序也是遵循最左前缀原则的。即存在一个索引 {name: 1, age: 1},使用 xx.sort({name: 1}) 也是可以使用索引排序的,但是很明显 xx.sort({age: 1}) 就不能使用索引排序了(因为索引中的数据是先按照 name 排序的,只有 name 相同情况下才会又按照 age 排序,那么显然不符合只按照 age 排序的要求)。
# 脚本
{$gt: ''}可以有效排除掉文档中无 phone 字段、phone: null、phone: '' 这三种数据
# 讨论区
由于评论过多会影响页面最下方的导航,故将评论区做默认折叠处理。